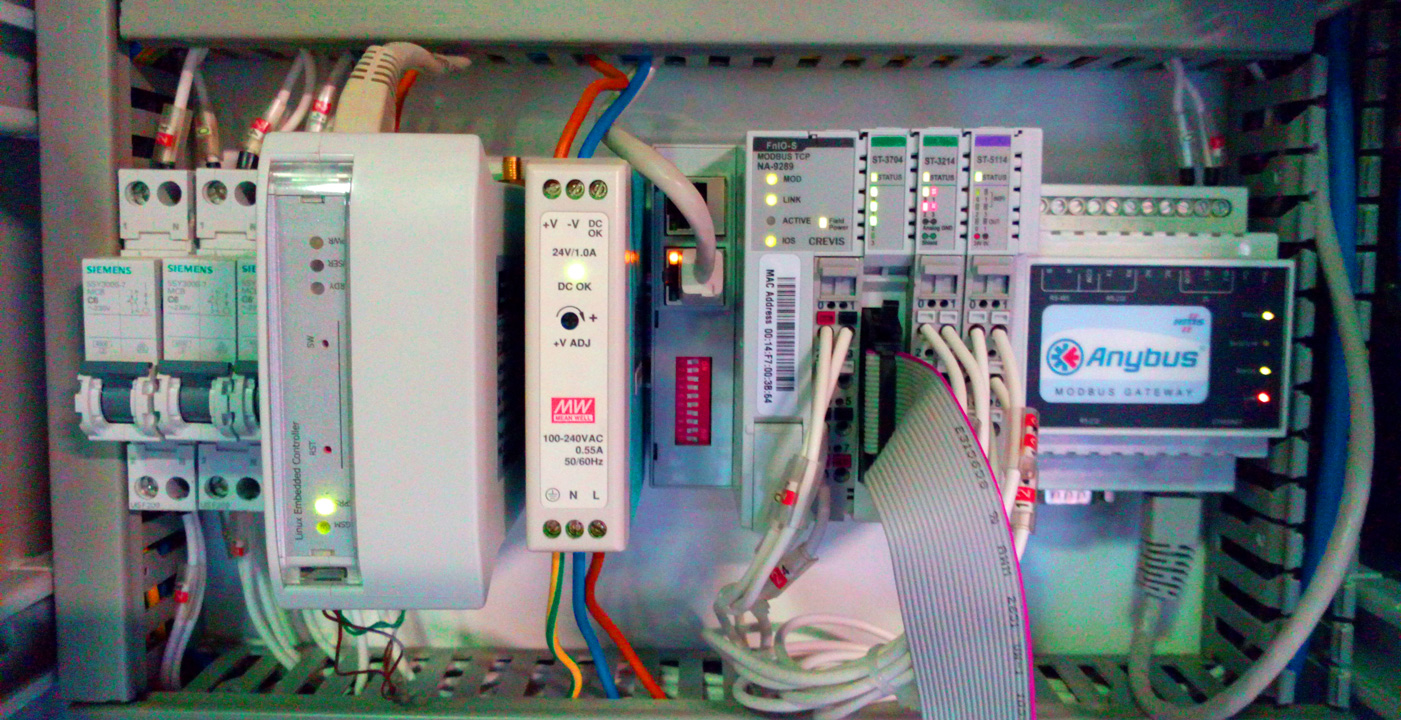
System Setup
Special configuration menus allow to manage accounts, schemes of each plant and required alarms. For each available feature, you can […]
Data downloading in several formats
Every report, both graphic and tabular, can be exported in various formats to be inserted into energy audit documents (images, […]
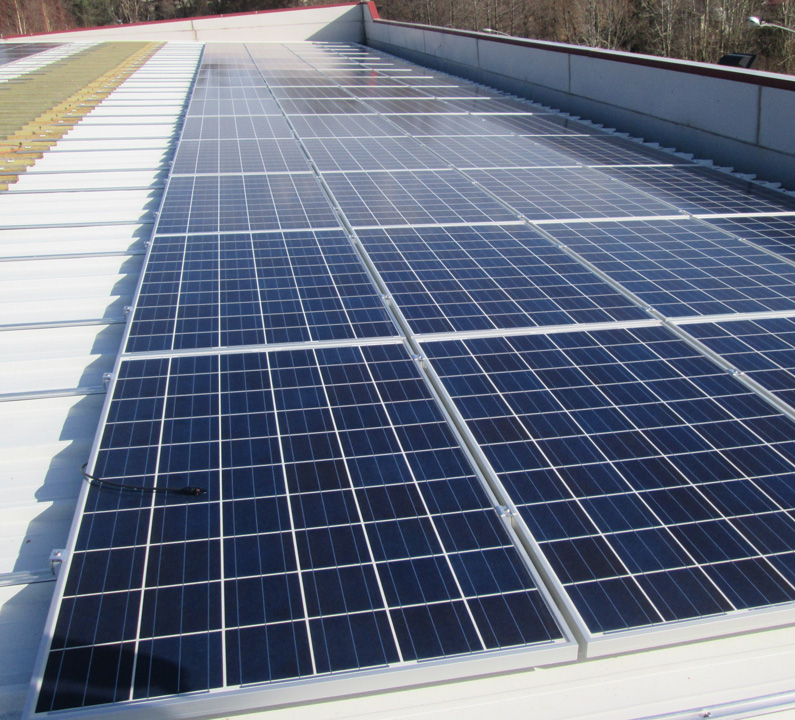
Energy Balance
If there are production plants (eg. photovoltaic systems), Ener2You allows to process the consumption and production data in order to […]
Historical Data Reports
Reports allow to create detailed graphical and tabular queries on individual measures coming from the monitored devices in a selected […]
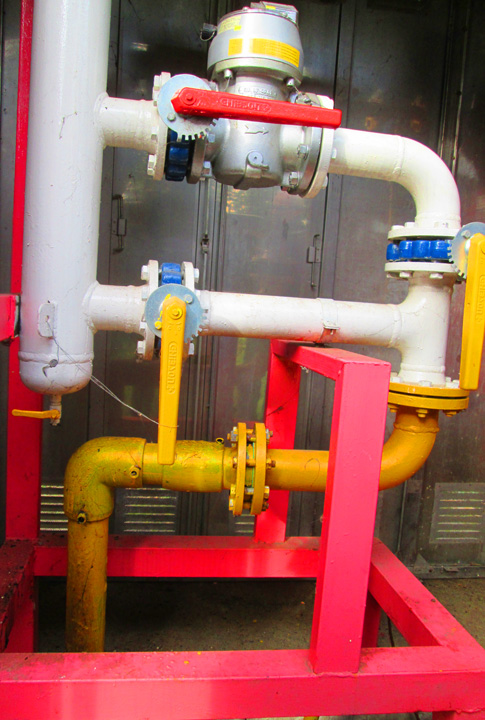
Time Slots Pricing Reports
Tabular reports on consumption of a given energy vector according to its own time slots pricing. Data analysis, highlighted with […]
Characteristic Curves Reports
Graphical reports on the average energy flows for specified time intervals based on the “factory calendar”. Thus you can have […]
Hourly Consumption Distribution
Tabular report showing the hourly distribution of daily consumption of a selected energy vector. This analysis allows to immediately identify […]
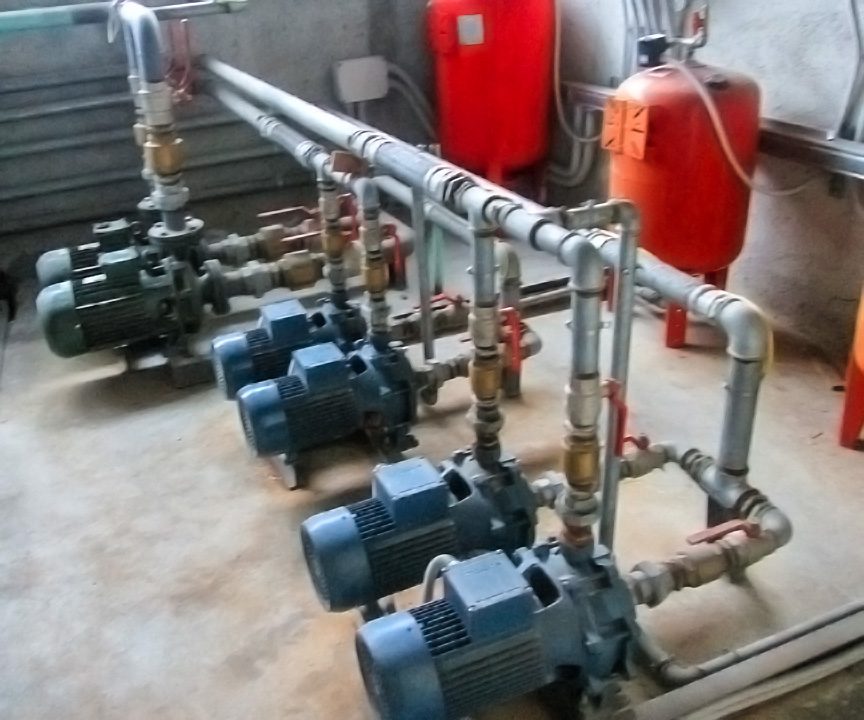
Energy Flows Reports ( production and consumption)
The portal can generate tabular and graphical reports to analyze flows coming from various energy vectors, by aggregating the measures […]
Centralized Managment of all plants
Ener2You provides a multi-installation and multi-user access in order to manage in a centralized way all monitored plants.